Teaching Beginners to Learn and Apply Google Analytics

You started your website to inform potential customers of your products or services and convert them into loyal customers. To do this effectively, you need to know where visitors come from, what they’re most interested in, and which touchpoints help turn them into customers. This starts with learning to apply google analytics well.

Recording and analyzing your data with GA4 will help you build digital marketing strategies to attract more visitors and make more money.

Follow these three steps to install and test Google Analytics:

Create and set up your Google Analytics account

Follow these instructions to create your account correctly:

  1. Go to analytics.google.com.
  2. Click Start measuring.
  3. Enter an account name (This is for internal purposes. We recommend using your company name.)
  4. Edit data sharing settings (optional).
  5. Click Next.
  6. Enter a property name(This is for internal use only and your website domain works well, especially if working with multiple websites under one company.)
  7. Check the reporting time zone and currency (This should be accurate for the business’s location).
  8. Click Show advanced options.
  9. Toggle the option to ‘Create a University Analytics property’ on (This is considered best practice to keep GA4 enhanced measures enabled.)
  10. Enter Website URL.
  11. Click Next.
  12. Enter industry and business size information (optional).
  13. Click Create.
  14. Accept the Google Analytics Terms of Service Agreement (Be sure to familiarize yourself with this before agreeing, as there may be specific privacy rules and regulations for your location.)

Add the GA tag to your website

You need to install the GA tag on your website before Google Analytics can collect any data. The simplest way to do this depends on your website setup.

If you’re using WordPress…

  1. Install the GA Google Analytics plugin.
  2. Go to the plugin settings.
  3. Copy your Measurement ID from Google Analytics.
  4. Paste the Measurement ID into the GA tracking ID box in the plugin settings.
  5. Select Global Side Tag from the Tracking Method options.
  6. Click Save Changes.

Alternatively, you can use Google Tag Manager (GTM). GTM is a somewhat advanced option for a beginner. Still, it’s my preferred method for adding on-page tags because I usually need to add multiple marketing performance tags (Facebook, HubSpot, etc.)

If you want to learn more about Google Tag Manager, read this.

Test your setup

Google Analytics tracking mistakes are common, so it’s crucial to test your setup before calling it a day.

There are a few ways to do this, but the most straightforward way by far is using Google’s Tag Assistant Chrome extension. It’s a legacy product, but it still works and is still available for download.

Here’s how to test your setup with the extension:

  1. Install the extension.
  2. Open your website.
  3. Click on the extension’s icon in your browser bar.
  4. Click Enable and refresh your webpage.

An incorrectly installed tag will be sad and red:

A correctly installed tag will be happy and green:

Google Analytics automatically begins measuring traffic to your website and user interactions such as page scrolls, outbound clicks, site searches, video engagement, and file downloads.

All of these auto-tracked events have the option to be marked as goals. Any additional goals, like form completions or phone calls, will need to be set up as an event using GTM. 

In your GA4 property, click “configure” in the left-hand navigation (it looks like a table icon).

You simply slide the toggle named “mark as conversion” for the events you’d like to trigger conversions from this screen.

Applying Google Analytics

With everything correctly set up, you’re probably wondering how to use this thing. This question is a difficult one to answer because there’s no single way to use Google Analytics. It can tell you hundreds of things about your website, so the way you use it will depend on the data you need to know.

For that reason, instead of trying to explain every single report here, I’m just going to cover the basics of how you can use GA4 to understand how users get to your site, what they do there, and the multichannel journey customers take to conversion.

Acquisition

Acquisition reports tell you how users get to your site. In GA4, this is separated into two categories: User Acquisition and Traffic Acquisition.

User acquisition reports are based on user engagement, while traffic acquisition is based on session engagement. This distinction is important because one user can have multiple sessions. For this reason, we will be explaining the User acquisition report.

To get to the User acquisition report:

  1. Log in to Google Analytics.
  2. Click to expand Life Cycle reports.
  3. Click to expand Acquisition reports.
  4. Click User acquisition.

You can segment your report by adding a comparison for User demographics, Device, or Custom events like a specific coupon code.

For now, let’s stick to a high-level view and keep this as “All Users”:

The bar graph and scatter chart will automatically populate using the metrics you set in the table below.

In the example above, we chose “First user medium” for the dimension in the first column of the table. This shows us the source by which users were first acquired. For example, “organic” combines traffic from all organic sources: Google, Bing, Yahoo, etc.

Engagement

Engagement reports tell you what users do on your site. Engagement is measured by the average length of time your site was the focus in the browser, the number of unique users who scrolled at least 90% of the webpage, event count, and conversion count.

Let’s take a look at just one of the Engagement reports Pages and screens.

To get to this report:

  1. Log in to Google Analytics.
  2. Click to expand Life Cycle reports.
  3. Click to expand Engagement reports.
  4. Click Pages and screens.

Segment your report by adding a comparison for the marketing channel you’re looking to analyze. For example, include dimension “First user medium” with a value of “organic.”

The bar graph and scatter chart will automatically populate using the metrics you set in the table below.

You can edit the dimension that will change the descriptive attribute or characteristic of data in column 1. For example, choosing “Page title and screen class” will show the page title, while “Page path + query string and screen class” will show the URL.

Remaining columns in the table show “metrics.” A metric is a specific element of the dimension. For example, the dimension for “Page title” can be associated with a metric like new users, unique user scrolls, event counts, and other engagement metrics.

Conversions

The conversions report tells you which user activities are contributing to the success of your business. For an e-commerce store, this might be making a purchase. For a lead generation website, it might be submitting a contact form.

In GA4, “goals” are measured as conversion events. The events data you see in your GA4 reports are triggered as users interact with your website.

To get to the Conversions report:

  1. Log in to Google Analytics.
  2. Click to expand Life Cycle reports.
  3. Click to expand Engagement reports.
  4. Click Conversions.

The bar graph and scatter chart will automatically populate using the metrics you set in the table below.

Within the table, you will find events listed by name, number of associated conversions, total users, and event revenue. Click on the name of an event to open a report about that specific event.

Click the dropdown menus in the upper left corner of the line chart to adjust metrics and dimensions in the report.

For example, you can choose to view the number of conversions or event values. You can also choose to see the origin of the events by Event source, Event medium, Event campaign, overtime, or by Google Ads metrics.

Add a secondary dimension, like city, to the explorer table by clicking the blue plus icon next to Column 1.

Setting up Google Analytics and understanding how to configure reports is just the beginning. The advantage of learning how to use GA4 is that you can answer marketing questions with real data.

If you just installed Google Analytics, you need to wait at least 24–48 hours to allow data to populate in reports—although I recommend waiting at least 3–4 weeks before making a decision based on reports.

Below are three simple ways you can use the data in Google Analytics to improve your website.

Improve traffic: Which channels bring in the most traffic?

At a very basic level, search engine marketing is about getting more engaged users to a site. To do this, you need to know which channels are bringing in the most traffic in the first place.

Here’s how to find your best performing marketing channels:

  1. Go to the User Acquisition report under Acquisition.
  2. Set Column 1 to First user medium.
  3. Click the New Users header to sort the table in descending order by traffic volume.

These marketing channels are bringing in the newest users (first-time visitors) to your website.

Explore other metrics in the table to further understand each marketing channel’s contribution to your website’s performance. 

For example, clicking on engagement rate or average engagement time tells you which marketing efforts are winning visitors’ confidence.

Engagement rate is the percentage of sessions that interacted with your website divided by all sessions. In contrast, engagement time is the average length of time your website was in the forefront of the user’s browser window.

To measure improvement add a comparison for your benchmark date range in the top right corner.

Content effectiveness: Which pages bring in the most traffic?

Understanding which content brings in the most organic traffic will help you fine-tune your content marketing strategy.

Here’s how to do it:

  1. Go to the Pages and Screens report under Engagement.
  2. Click All users at the top of the screen.
  3. Change the dimension to First user medium.
  4. Select organic as the dimension value.
  5. Click Apply.
  6. Click the New Users header to sort the table in descending order by traffic volume.

These organic landing pages are bringing in the newest users (first-time visitors) to your website. You will want to create more articles like these.

On the flip side, click the header a second time to sort the table by ascending value. If there are organic landing pages with zero user traffic, you will want to reevaluate their relevance to your business goals and adjust your strategy accordingly. This may include republishing the content or removing it from your site.

Geographical targeting: Where do my best customers come from?

If you’re investing in ads or multi-location SEO, you need location-specific insights to understand where to increase or decrease marketing efforts. You can use the Demographic details report for this.

Here’s how to do it:

  1. Go to the Demographic details report under Demographics.
  2. Sort the table by engagement rate, specific event, or total revenue.

This report is very useful for fine-tuning Ads location targeting.

If you want to get more specific with your segmentation, click the Country dropdown in the first column of the table and change it to Town/City or Region.

The bottom line

Setting up Google Analytics may feel like learning Klingon, but a basic report setup is all you need to get started. Investing twenty minutes of your day to learn how to set up  and how to pull a handful of reports will pay for itself time and time again.

Success is in the data.
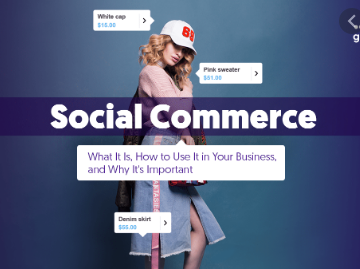
Consumer Engagement is the Key to a Social Commerce Business

Nonversation?  Heard that term before?  In context with a social commerce business?  Hope not.  Simple definition: the opposite of a productive conversation.

Social commerce business.

Many nonversations transpire at elevators, bus stops, and the like. They also occur during business situations, in which participants do not really listen meaningfully to one another. Not what you want for a world-class social commerce business.

We define social commerce business as the use of social engagement to personalize and energize the shopping experience. It provides a social context to shopping and is both a channel and a way of doing business.

As Warren Buffet has so famously said, “When the tide goes out, you see who’s not wearing a bathing suit.”  Well, the tide has certainly gone out and there are a lot of naked companies around.  Many of the failed companies will insist that they had been the victims of a “perfect storm.”

However, in the years to come, it will become apparent that some companies have actually used the crises to gain market share, increase employee loyalty and enhance profitability while their competitors were crumbling.

So how do we propose to build a world-class social commerce business? Here are 10 ways we recommend to our clients:

It starts with great employees

Employees are your service. Hire for their friendly, caring attitude and train for skills and knowledge. Empower them to be customer advocates.

Make social the centerpiece

Socialize your business. People do business with people, so make it personal. Customers should want to do business with you because of you and your employees. Make your customers “feel at home.” You may have a great location, cool displays, great value, etc.

That’s all great, but if your people can’t make your customers feel welcome and appreciated, all of the other doesn’t matter so much.

Share all great service stories

As soon as possible with all of your team. Celebrate the smallest of successes.

Show common courtesy

Use common courtesy.

All the time. This leads to customer respect, which leads to conversation and the building of relationships and mutual trust.

Care for customers

Assume you are the company owner. Not all owners or executives make great leaders, but the ones that are should be emulated. Watch how they take pride in how they deal with customers and employees, and then follow their lead.

Analyze when things go right.

When a company receives a complaint people usually have discussions to find out what went wrong and how to prevent it from happening again. Next time you receive a letter of praise, meet to find out what went right and how it can be repeated.

All the time.

Amazing companies don’t always deliver “Wow!” type experiences, they are just better than average – all of the time. All of the time is the secret sauce.

Attention to details

 Sometimes it’s the little things that make the biggest impact. Figure out the details that your customers enjoy and make them a routine part of doing business with you.

Be vigilant … always listening and learning. Try and remember things customers tell you and then show them you listened. Trying new ideas. Put your social commerce business in motion by being adaptable.

Customer experience

 One sure way to erode loyalty and social commerce is to deliver an inconsistent customer service experience. One time it’s great. The next time it is barely average.

And, the next time it may be great again. Inconsistency creates uncertainty and erodes customer confidence and trust. Lack of confidence and trust leads to giving customers a reason to consider your competition.

Create a customer service culture

It starts by practicing what we call, “The Employee Golden Rule”: Treat your employees the way you want the customer treated – maybe even better.

Now it’s up to you. Choose one customer service strategy to start with. Have a meeting around it. Discuss how to implement it. Then, do it and repeat the process, creating something good for your customers to talk about! Soon you will have a much stronger social commerce business.

Please share a social commerce business experience with us.

Like this story?   Follow Digital Spark Marketing on LinkedIn for 3-4 short, interesting blogs, stories per week.

Digital Spark Marketing will stretch your thinking and your ability to adapt to change.  We also provide some fun and inspiration along the way.

Reading from Digital Spark Marketing’s library:

8 Popular Social Media Initiatives for Customer Engagement

Does Your Business Build Customer Trust?

Social Commerce Business … What Ben and Jerry’s Knows That You Should Know

Chicago is Winning the Online Branding Battle

There are certainly many new start-ups looking to take advantage of change driven by the internet, yes? And many looking to win the online branding battle also. And if your business is looking to question of Chicago is winning the online branding, where should you turn?

The entrepreneur always searches for change, responds to it, and exploits it as an opportunity.

Peter Drucker

It was over eleven years ago when Mark Zuckerberg and his college roommates were checking out the cute girls on campus with a “hot or not” approach on a program called “Facemash.”

Today, millions of people like me can be watching their distant grandchildren, nieces and nephew come of age online through pictures and videos posted on the internet, thus dubbing them cute or adorable. Sometimes it is difficult to remember what life was like before the world wide web gave birth to the many different social media networking sites.

When it came to launching a new social scene online, buddies Kevin Systrom and Mike Krieger knocked one out of the ballpark when they created a photo-sharing app called Instagram. Just after midnight on October 6, 2010, Kevin put their creation in Apple’s online app store.

Their picturesque creation exploded on the internet with over 10,000 downloads in the first few hours, having the duo scrambling to keep up with that massive internet traffic. Less than two years later, Facebook acquired Instagram for a cool $1 billion in cash and stock.

Given the hundreds of social media options available, which is better for branding your business online? Although Facebook still has the most global users, what about other sites like Twitter? Is Google+ better than LinkedIn for connecting with other businesses?

Related post: Building Key Requirements for a Strong Brand Identity

A significant portion of a company’s value is intangible, so a strong brand is a significant competitive advantage. As Philip Kotler wrote:

The art of marketing is the art of brand building. If you are not a brand, you are a commodity. Then the price is everything, and the low-cost producer is the only winner.

Brands, marketing, and communication have long been highly related. From TV ads and press releases to events and endorsements, the way consumers view a brand will influence their decision making, so crafting and reinforcing a brand image has long been a top priority for marketers.

Who is winning the branding battle online? Let’s take a look:

visual tale
Visual tale.

Best of brand battle rounds … brilliant branding

With over 300 billion users globally, Instagram is beating out rival Twitter in some surprising ways. Recently, Socialbakers compared 25 of the top brands on social media and found that the photo-sharing platform has engagement rates 50x higher than that of Twitter users. The average interaction rate of these brands is 38x higher on Instagram compared to that of Tweeters.

Instagram is giving businesses a real opportunity for visual storytelling and branding within this tight-knit community of photo-sharers. These photogenic users are embracing their favorite brands on board this popular site.

communities
Communities.

Online branding battle … communities or groups?

While the search engine giant Google and social networking star Facebook continue to battle for online supremacy, business-minded LinkedIn continues to chime in on the scene. But what about Google Plus? Which is better, Facebook and LinkedIn Groups or Google+ Communities?

If you were to compare them side-by-side, Google+ would seem to have better features compared to Facebook, while Hangouts is a popular choice for sharing information on events. LinkedIn wins out when it comes to highlighting influencers in a group, which makes discovering new connections and engagement even easier.

Chicago is winning the branding battle

In the uber-competitive restaurant market, Starbucks is making a killing branding online. With the most likes on Facebook, leading the race of followers on Twitter, Google+ and Pinterest, they are blowing away big competitors like McDonald’s and Taco Bell. They also hold the number two spot on YouTube and Klout.

Their “Buy One Get One” free beverage campaigns create tremendous social buzz and get shared all over social media. They also encourage community spirit with charitable donations associated with purchasing their products and connect with their customers on a more human level with personalized drinks and customer reward programs.

We can take some valuable branding advice from our caffeine-infused marketing pros over at Starbucks and make a valuable connection with our internet audience.

Takeaway

Whether you’re adding interest on Google+, connecting with colleagues on LinkedIn, telling a visual tale on Instagram, posting or Tweeting, we marketers need to make the best of branding online.

To be effective in this new era, we need to see our jobs differently. No more just focusing on metrics like clicks, video views or social media shares. We must successfully integrate our function with other business functions to create entire brand experiences that serve the customer all the way through their experiences throughout the business.

We can do better. Much better. But first, we need to stop seeing ourselves as crafters of clever brand messages and become creators of positive brand experiences.

Need some help in capturing more customers from your branding design strategies? Such as creative branding ideas to help the differentiation with potential customers?

Call today for a FREE consultation or a FREE quote. Learn about some options to scope your job.

Call Mike at 607-725-8240.

All you get is what you bring to the fight. And that fight gets better every day you learn and apply new ideas.

When things are not what you want them to be, what’s most important is your next step. Call today.

Test. Learn. Improve. Repeat.

Digital Spark Marketing will stretch your thinking and your ability to adapt to change.  We also provide some fun and inspiration along the way. Call us for a free quote today. You will be amazed at how reasonable we will be.

More reading on brands and branding from Digital Spark Marketing’s Library:

New York Yankees … 11 Awesome Lessons From Yankees Brand

The CVS Rebranding Strategy: a Case Study

6 Favorite Brands and Why I Like Them So Much

Brand Management … 12 Ways to Humanize the Brand to Build Trust

Walmart E-commerce Strategy … 6 Reasons Why It Won’t Beat Amazon

Mike Schoultz is a digital marketing and customer service expert. With 48 years of business experience, he consults on, and writes about topics to help improve the performance of small business. Find him on FacebookTwitterQuoraDigital Spark Marketing, and LinkedIn.